Clustering crypto markets (digital assets)
The SynergyCrowds platform includes an application that performs clustering on crypto markets.Features
Access the clustering application
- Log In to the SynergyCrowds platform at https://crypto.synergycrowds.com
-
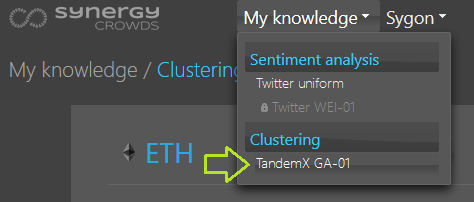
Top menu: "My knowledge" -> "Clustering" -- "TandemX GA-01"
Visualize crypto clustering analysis
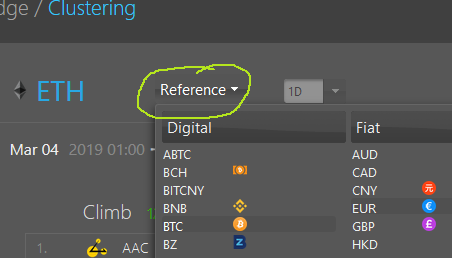
The clustering app shows by default the last clustering analysis for crypto assets relative to BTC.However, the user can choose from a list of many other reference crypto assets:
- Access the clustering app
-
Select a different reference asset from the "Reference" menu:
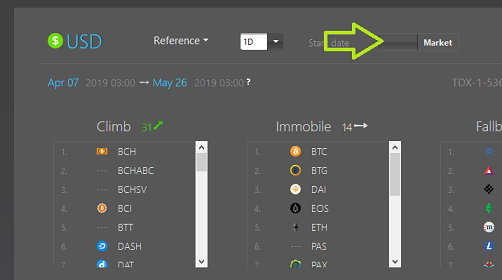
Previous clusters
The clustering app shows by default the most recent clustering.However, the user can access previous clusterings on historical data:
- Access the clustering app
-
Click on 'Start date' field to open the calendar
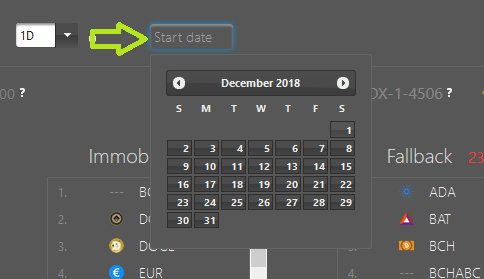
- Pick a date of your choice. (This is the start date of the timeframe for the computed clustering)
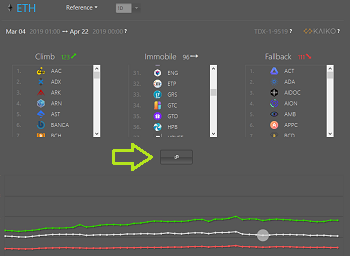
Export chart with clusters trendlines
The user can easily export the chart containing the trendlines of the discovered clusters:- Access the clustering app
-
Click the export button shown on top of trend lines chart
-
A new window showing the chart appeares.
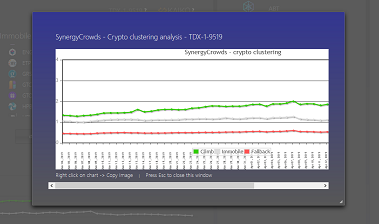
To copy the chart image, Right click on the chart -> "Copy Image" option - This chart image can be directly pasted where you need it.
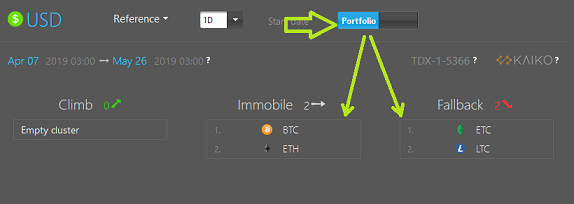
Market / Portfolio filter
The user can filter the clusters by applying the content of her own portfolio:- Access the clustering app
-
Click the 'Market/Portfolio' switch
-
The clusters are filtered, showing only the content of the portfolio.
Learn how to create a portfolio with a data builder.
Data
The clustering app uses crypto market data provided by Kaiko:- Daily VWAP
- 3169 symbols
- 51 exchanges
- 3531 symbol pairs
- clustering analysis timeframe: 50 observations